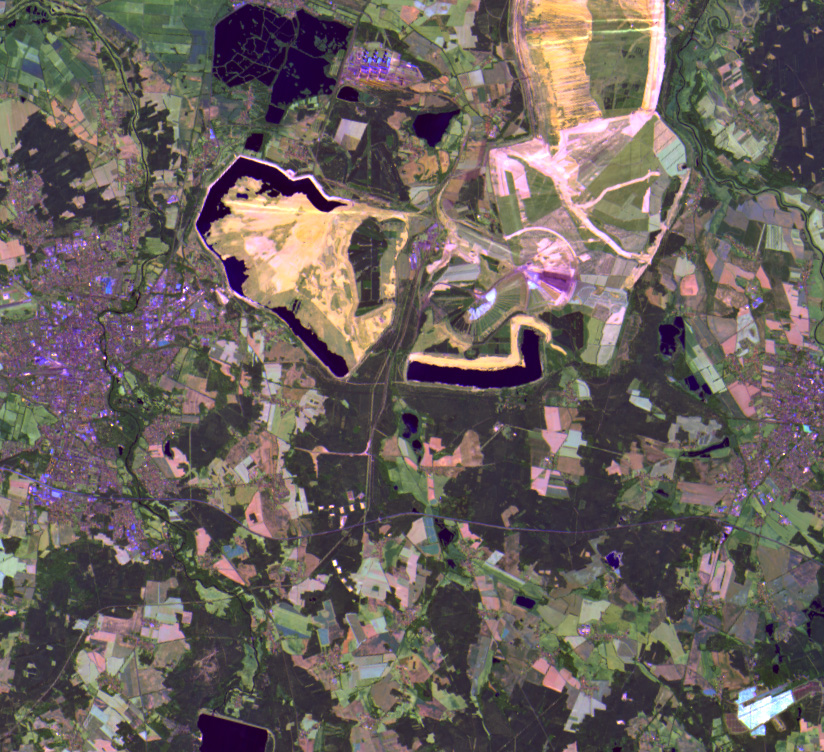
Since the mid-19th century, the Lower Lausitz area has been developing as a center for open lignite mining, with one of the largest mining areas located between Cottbus and Forst, and associated with a tremendous landscape transformation until today. The EnMAP image acquired on the 20th of July 2022 shows the complexity of the landscape between the two cities, composed of agricultural areas, forests, and active and closed mining areas (Image 1). Due to the increasing demand for independent, sustainable and climate-friendly energy production, the areas converted to large photovoltaic (PV) power plants have been increasing steadily.
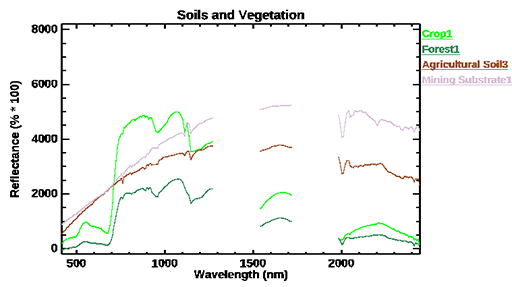
The spaceborne monitoring of large-scale PV power plants is a new research field, where hyperspectral sensors can play an important role. Spectral representation of PV modules changes depending on the module type and the orientation of the module towards the sun and the sensor. Image 2a shows typical spectral reflectance measurements of monocrystalline and polycrystalline PV modules taken by EnMAP. These spectra are mostly mixed with agricultural soils and vegetation spectra illustrated in Image 2b. Based on EnMAP raw data and calibration tables, the fully-automatic processing chain performs radiometric corrections, orthorectification and atmospheric compensations to obtain surface reflectance. In the course of the commissioning phase the EnMAP product quality is verified and validated.

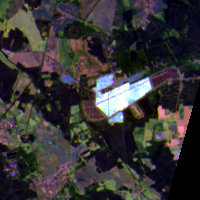
In a first analysis, the surface covered by the polycrystalline solar panels is estimated using EnMAP data. In the specific, Image 3 reports the results of linear spectral unmixing, which allows estimating the fraction of each pixel covered by the panels. The density of the PV panel is mostly homogeneous and roughly corresponds to two-thirds of the total area of each pixel. The main additional contribution to each pixel comes from bare soil. These observations well agree with our visual analysis of high-resolution images of the area.

In the future, the technique of spectral unmixing will be enhanced and tailored to measure the so-called soiling effect on panels describing the pollution of the panels with, e.g., dust and polls coming from the immediate surroundings. Soiling may influence the efficiency of energy production, and its estimation can be important for the maintenance of large PV power plants, especially in desert areas, where PV panels must be routinely cleaned.
As a proof of concept, we simulated soiling on the panels in Image 3b by altering the proportion of soil present in each pixel, relying on representative soil spectra within the same area. The subsequent unmixing results in correct estimations of the decreased PV surface with a 99% accuracy. Image 3c shows the pathways between the polycrystalline panels as well as the heterogeneity of the spatial density of PV panels, which can also be related to their contamination with dust and polls. Smaller patches of PV abundance at the middle left and lower right of Image 3c correspond to additional smaller PV power plants (see Image 3a).