Brief Summary
Forest, bush and steppe fires destroy several million hectares of ecologically valuable stands worldwide every year and make a significant contribution to global warming through the release of CO2. Remote Sensing technology allows for prediction, detection and damage assessment related to wildfire and can thus deepen the understanding of fire-related processes. Thus, wildfire research can play a significant role in the mitigation of wildfire risks. With the current availability of data from EnMAP, fire ecological studies based on a high spectral resolution are now possible for the first time over distributed geographical areas and extended time periods.
Aims
This undertaking pursues three goals:
Firstly, the multitude of available EnMAP bands is used to investigate the band combination best suited for wildfire burnt area assessment. EnMAP features 17 bands in the red, 29 in the near-infrared (NIR), and 72 in the longer short-wave infrared (SWIR) domain, which are highly valuable for the task of burnt area assessment. Such information about optimal wavelengths is crucial for the future design of optical sensor instruments targeted at wildfire applications. The results of the analysis will be used in the project SERAFIM.
Secondly, the acquired knowledge is used to accurately derive burnt areas from EnMAP data. This provides insights on the effects of wildfire regarding different wavelengths, and allows a hyperspectral comparison of such effects over various vegetation types and climate zones.
Thirdly, regions affected by fires and featuring multiple EnMAP acquisitions can be invoked to monitor vegetation recovery cycles. This is done in order to derive a relationship between fire intensity and vegetation resilience over time, regarding different climatic preconditions. Post-fire plant population structure and composition, as well as the temporal succession of plant communities are critical variables for understanding ecosystem response to fire impairments. Monitoring fire-induced vegetation dynamics in as much detail as possible is necessary to study the ecological impact of fire on ecosystem functions and to design restoration efforts accordingly.
Study
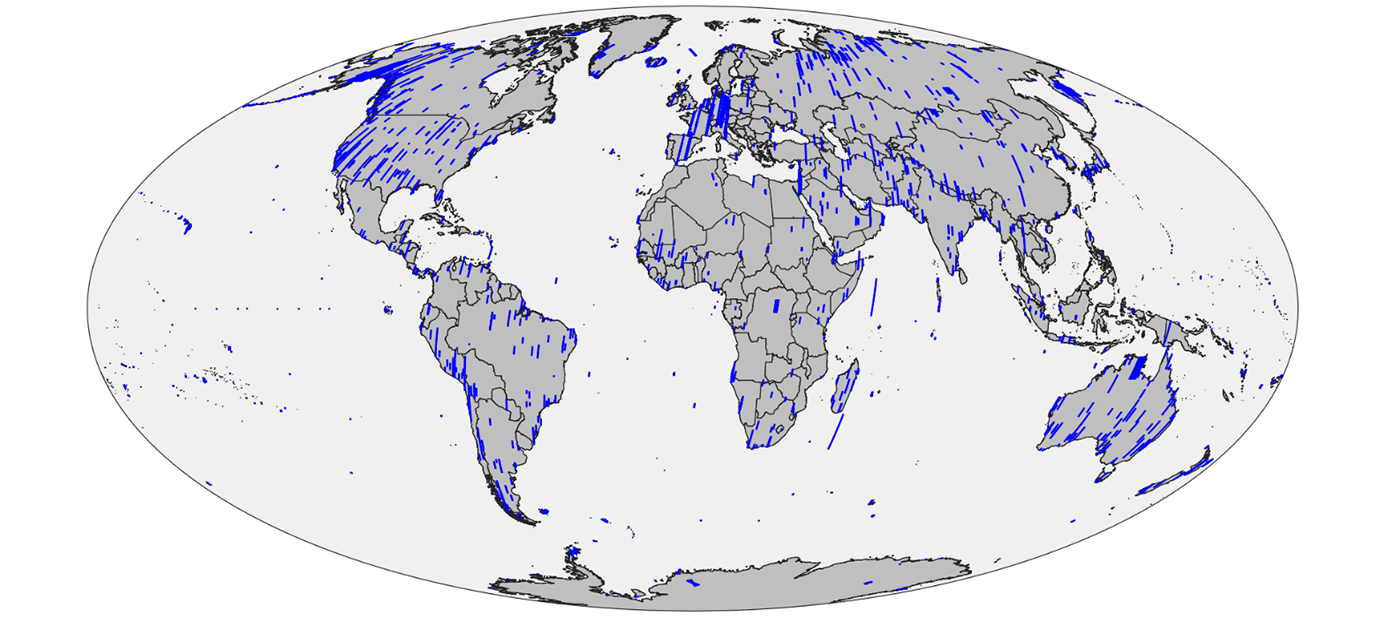
The first step consists of the analysis of EnMAP metadata, and combine all available acquisitions information in a homogenous, GIS enabled data structure. Figure 1 gives an overview of all acquisitions available in the EnMAP archive, for the time range from June to October 2022.
As a second step, the footprints of acquisitions are merged with auxiliary information from the NASA FIRMS project, which maps thermal anomalies. It is targeted at wildfire hotspots. The data is available globally and with a temporal resolution of 2 to 4 overpasses per day. The provided information encompasses the fire location (in mid-resolution, 1000x1000 and 375x375 sq meter, respectively), the exact time of detection, the accurate pixel size, and the energy radiated (“Fire Radiative Power”, FRP) of each fire. This allows the enrichment of meta data for each EnMAP acquisition with the following information:
- Administrative unit: The country / state predominantly affected by the fire
- Fire ratio: The ratio of affected area within the scene (considering fires which occurred within two weeks before the scene acquisition)
- Burnt area: Burnt area in hectares, derived from the hotspot locations and pixel size
- Land use / land cover: The LULC class predominantly affected by the fire
- Climate: The climate zone predominantly affected by the fire
- FRP: The averaged Fire Radiative Power of the fire, equivalent with fire intensity
- Time delta: The averaged temporal distance between fire hotspots and the acquisition date
- Pre/post: The number of pre/post images overlapping with the fire area
Figure 2 shows an exemplary EnMAP acquisition (the one featuring the largest affected area in September 2022), augmented as described.
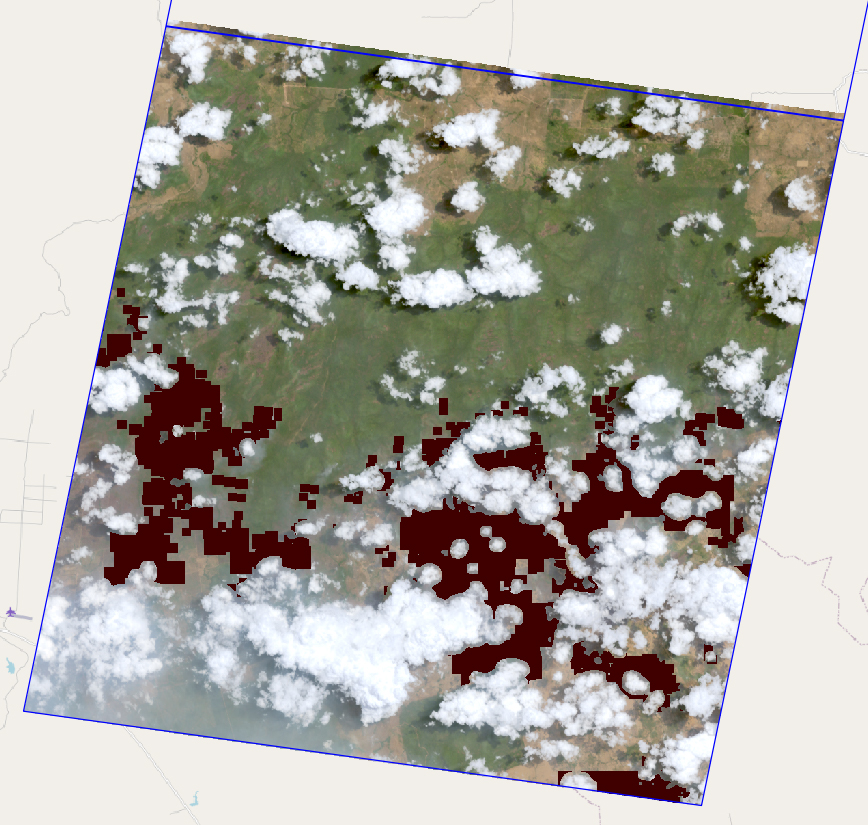
| Predominantly affected country / state | Brazil / Pará |
| Fire ratio | 19.7% |
| Burnt area [ha] | 18227 |
| Predominantly affected Land use / land cover | [50] Tree cover, broadleaved, evergreen, closed to open (>15%) |
| Predominantly affected climate zone | [3] Tropical, savannah |
| Average FRP | 1.0 MW / km2 |
| Averaged time delta | 7.85 days |
| Available pre/post images | 0/0 |
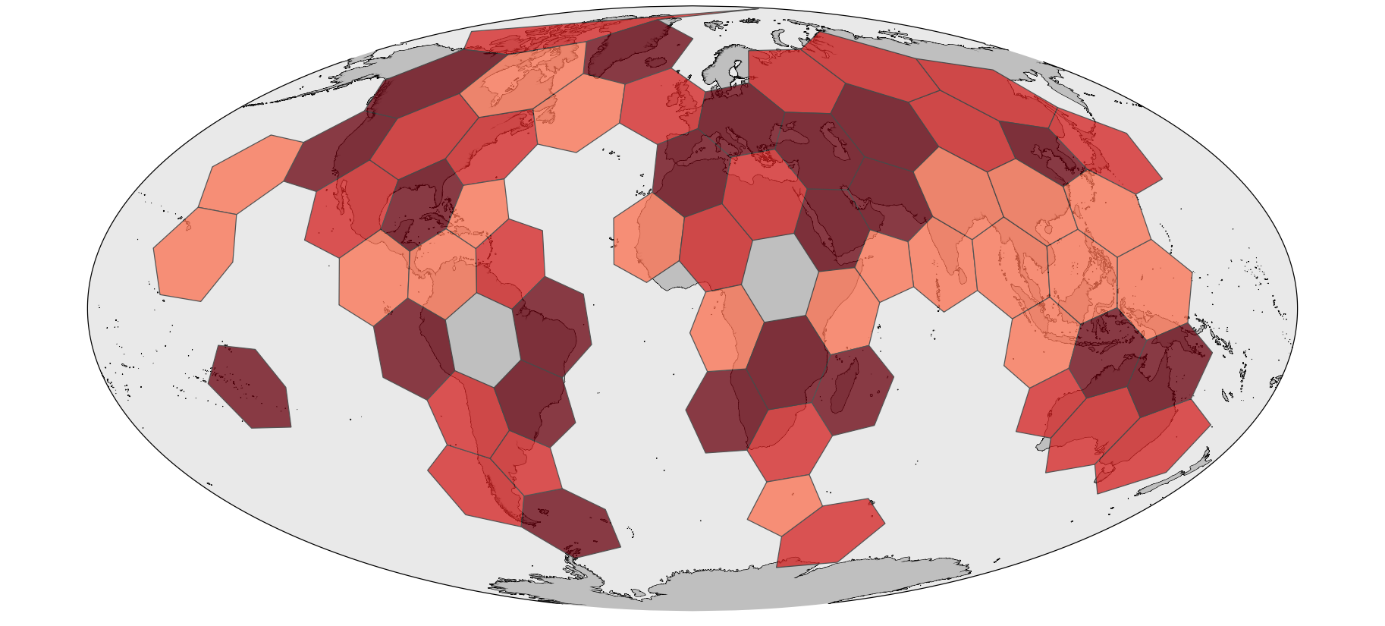
This augmented information allows the filtering of the archive, to select scenes which are especially suited for analyzing wildfires. Figure 3 shows regions around the globe, where acquisitions are available featuring a right ratio of burnt area.
The selected acquisitions can then by analyzed regarding the suitability of the contained bands regarding burnt area derivation. The Normalized Difference Vegetation Index (NDVI) and the Normalized Burn Ratio (NBR) are helpful proxies for assessing wildfire damage to vegetation. The first one is calculated using information from the red and the near-infrared (NIR) domain, while the latter uses the NIR and SWIR domain. Hyperspectral data provides a multitude of bands in these domains, which allows for an extensive study where each possible combination is evaluated. Such a study was performed [by Nolde, M.; Plank, S.; Riedlinger, T. Utilization of Hyperspectral Remote Sensing Imagery for Improving Burnt Area Mapping Accuracy. Remote Sens. 2021, 13, 5029] regarding the DESIS instrument, using the NDVI. Such an investigation will be performed in this undertaking, this time using the NIR and SWIR domains. The findings will then build the basis for the presented burnt area derivation and the post-fire recovery monitoring steps.